CASSANDRA
[“phenomenon” or “complex”, Metaphor]
From Greek mythology; relates to a person whose valid warnings or concerns are disbelieved by others
Project timeline: 7 weeks
Project team: Riad El Soufi
Project Cassandra is a dedication to the ephemerality of the Earth we inhabit and our impact on climate over the last 30 years. It is our take on capturing climate change through stitching together 30 years of satellite imaging and environmental data.
Project Cassandra was inspired by Justin Braaten’s project on Visualizing Changing Landscapes with Google Earth Engine. His project showcased how changes in water bodies over time can be visualized. We were emotionally dumbfounded and struck by the incredibly powerful imagery portrayed in this visualization. We knew at that moment that we wanted to share these emotional reactions with people while providing a realistic and empirical point of view about climate change.
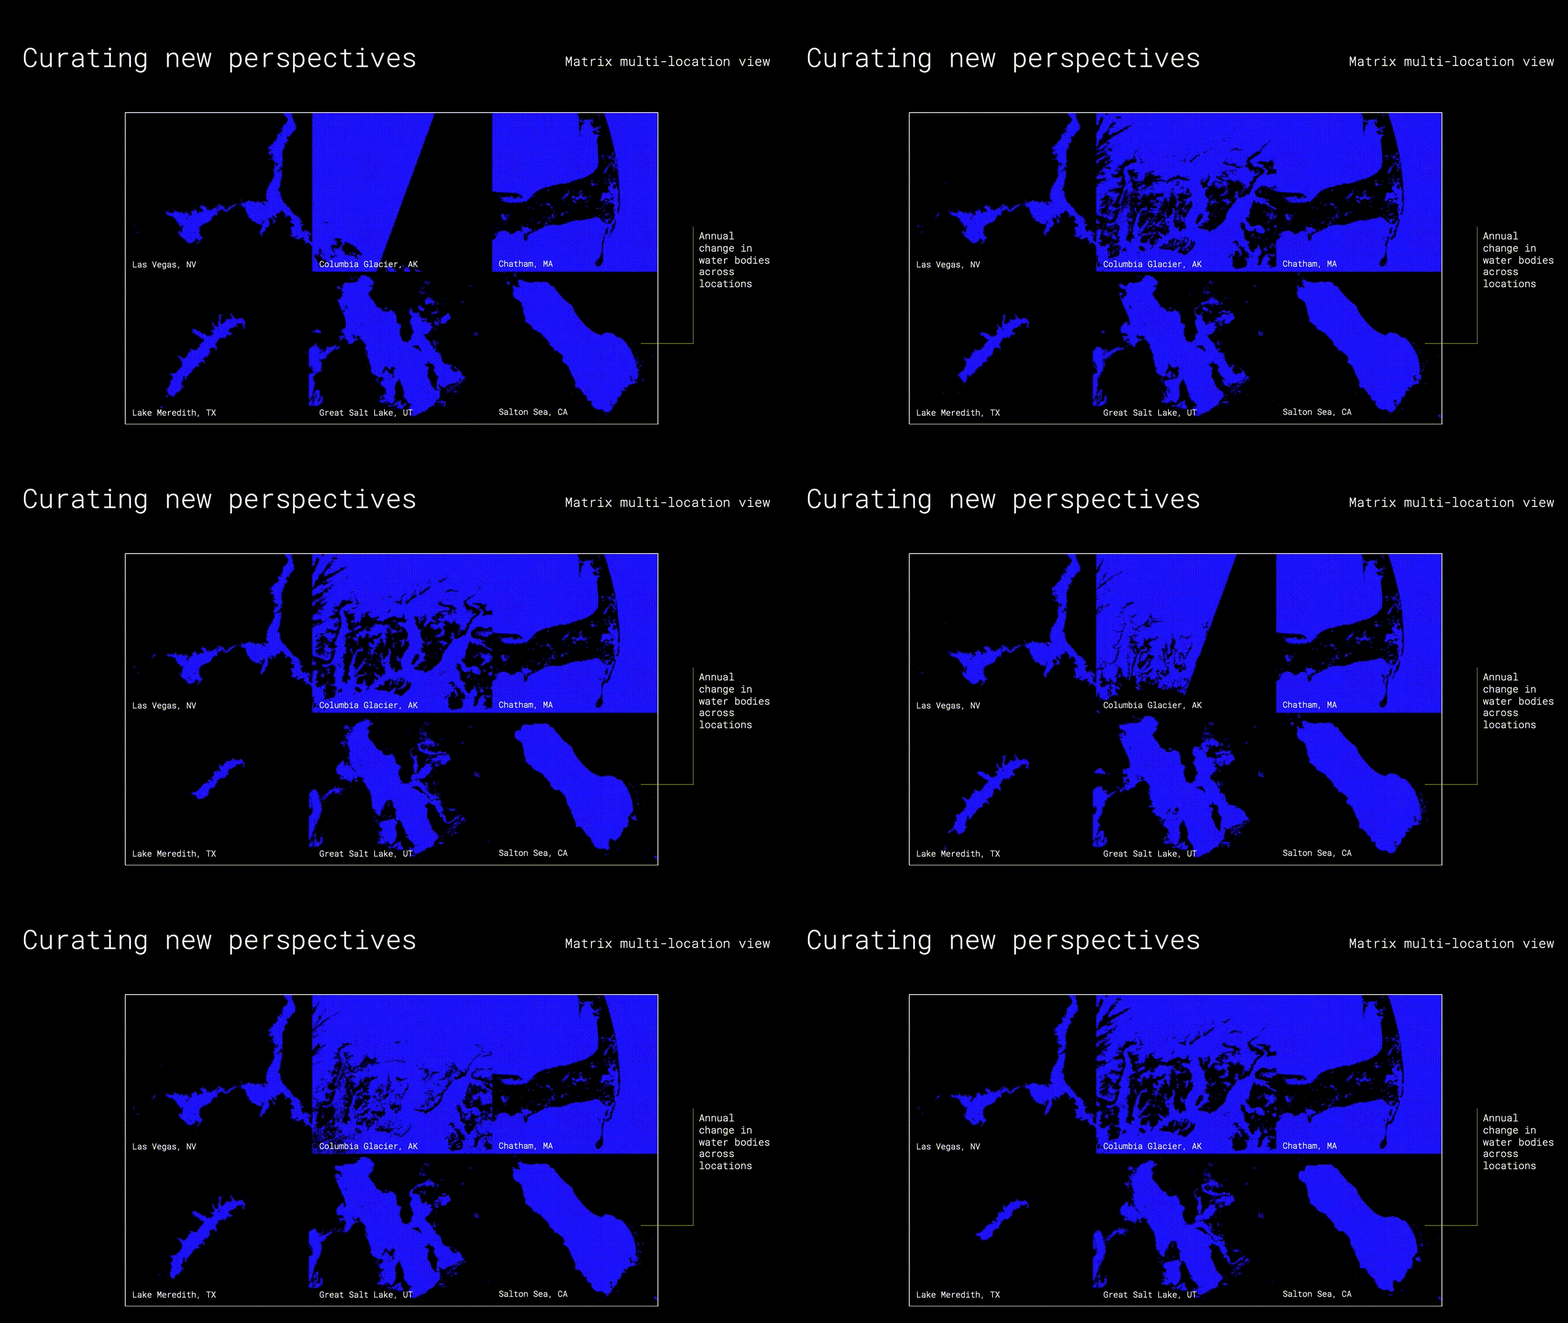
We hope to tell a story about consumption and loss in America through six thoughtfully selected locations that have had some of the greatest landscape changes over the years.
Communication around climate change is incredibly challenging. It is a story that is difficult to tell because of its intangibility at the grander scale. It is an emotive, empirical, and real issue—which makes it especially complex.
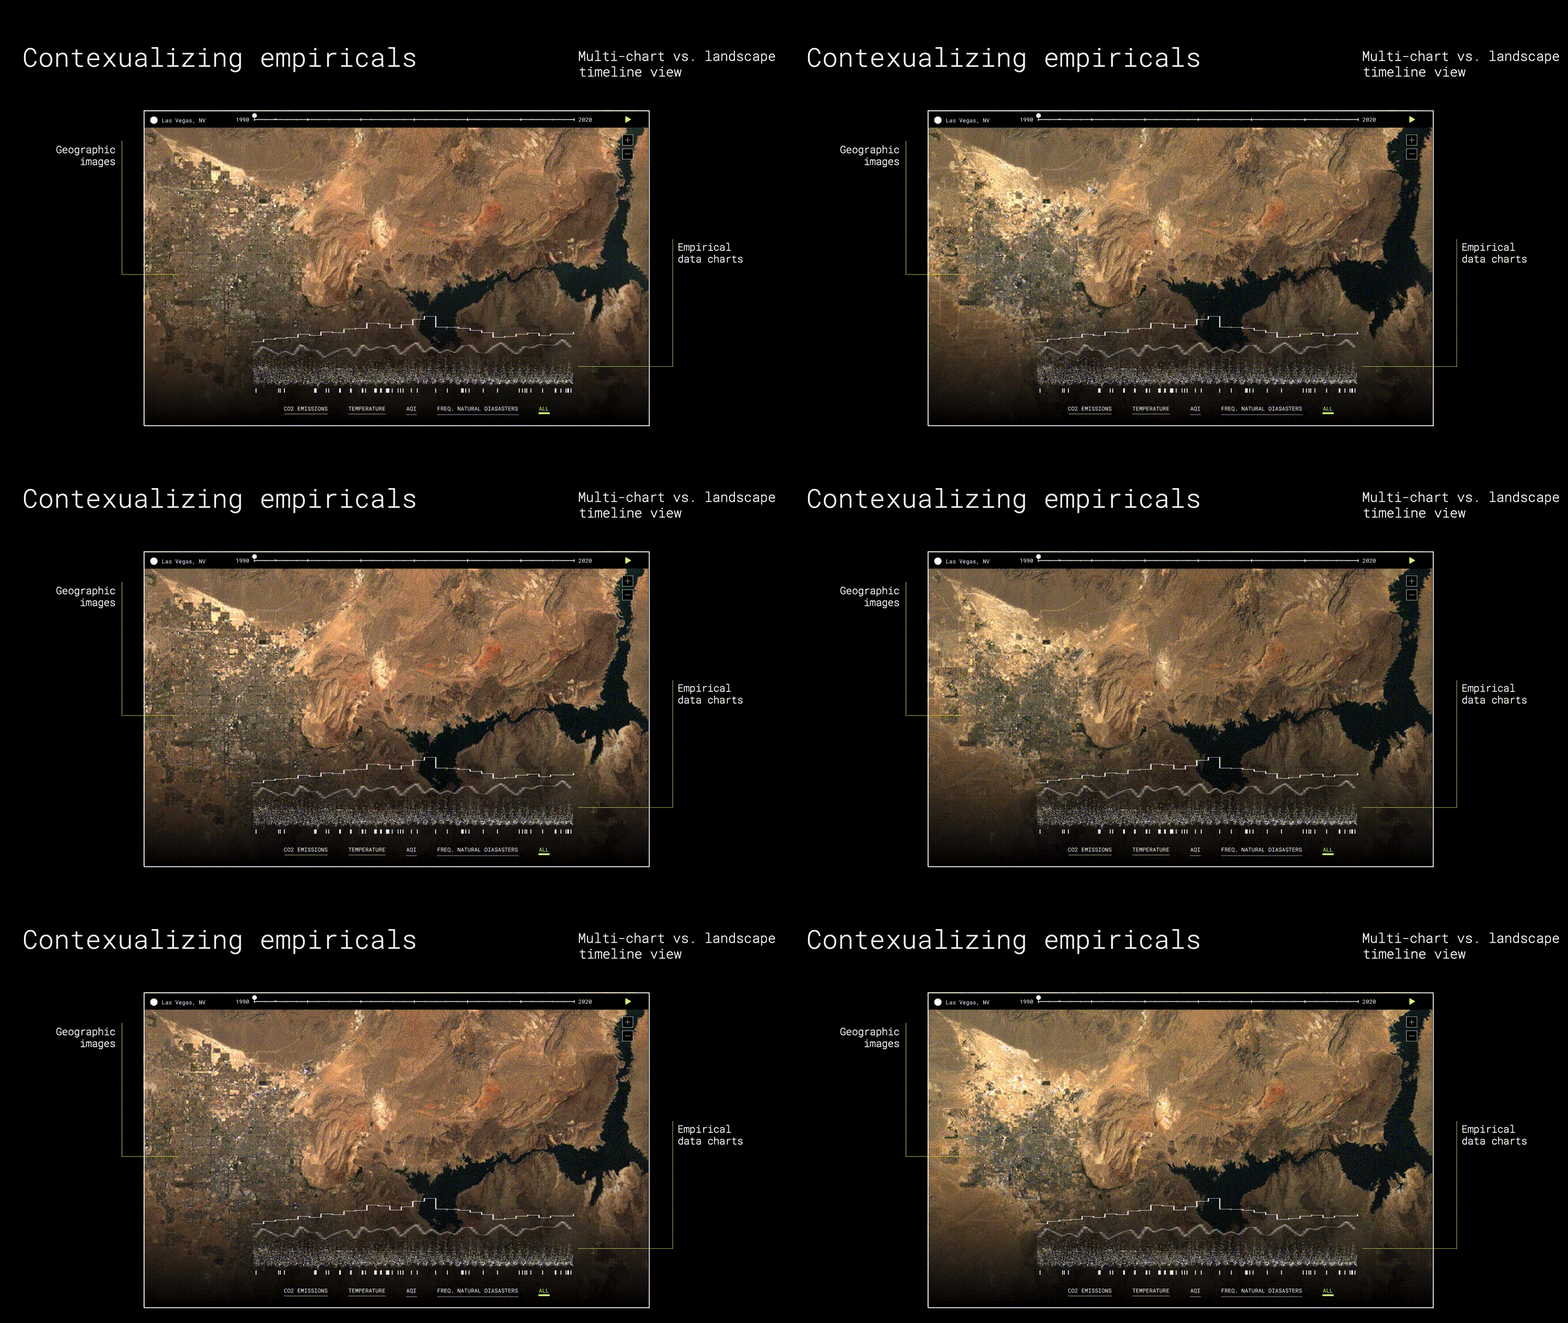
…yet sometimes visuals lack a timeframe or comparative aspects to help draw clearer conclusions as a collective picture of what is happening, like showing a picture of a polar bear, or flooded communities.
…yet the charts documenting it lack a visual or comprehensible point of reference. It’s difficult for the average person to understand what an additional 2 degrees Celsius of warming means. Do you? I don’t.
Above all, Climate change is real and its impact can already be visualized across the globe. For example, in Lake Mead, Las Vegas, years of higher temperatures and drought have caused the lake to shrink by 37% of its area in the span of 30 years.
Project Cassandra aims to make the climate change concept more accessible while maintaining a speculative point of view.
We had two primary datasets—what we like to call a ‘quantifiable’ and a ‘visual’ set. However, the key here is in making our visual data quantifiable through image analysis.
We believe our project has immense value in its ability to scale across locations and grow as time goes on, infinitely.
As satellite imaging technology continues to mature, the wide availability of these images captured globally, even in the most remote and obscure of places, can be leveraged to create a platform that follows an automated process to produce the images we developed through recursive processes or manually. The platform can be used to inspect more minute-by-minute and detailed landscape changes, predicting and revealing issues and perhaps even suggesting solutions to problems before they arise.
We highly encourage you to explore the Google Earth Engine yourself and see how the places you hold near and dear to your heart has changed over the last 30 years.
-
Dear Earth,
We love you.
Connie & Riad


